|
Aug 21, 2008
India’s Future Climate: No Cause for Alarm
By Dr. Madhav Khandekar
India as a whole is dominated by the monsoonal climate where the summer rainfall (called the southwest monsoon, June-September) is the most important climate event. Traditionally, India has been an agricultural country where timely arrival of summer rainfall becomes critical for the monsoon crops (known as Kharif), most important of which is rice, grown primarily in the Peninsular India. The four summer months provide an average of about 85 cm ( ~40 inches) of rainfall over most of India. (this is one of largest amount of seasonal rainfall anywhere in the world over a large area like India). Outside of summer monsoon, India does experience winter rains via the northeast monsoon season (December-February) which provides rains (albeit much smaller amount) to the southeast Peninsular region of India and parts of Sri Lanka. In the northwest parts of India, some winter rains are produced (~5 cm) in the wake of western disturbances which are part of mid-latitude weather systems making their way into northwest India through the western Himalayan passes. The southwest monsoon season is the most important rainy season for India’s agriculture and also for re-charging of water levels in a large number of reservoirs in and around big cities in the Peninsular India like Mumbai, Pune, Hyderabad and Bangalore. This is also the season for many rivers to be recharged and distribute their water to a large number of villages and towns.
The Indian Monsoon together with the south Asian monsoon is the largest seasonal abnormality in the global climate system and impacts about 60 percent of world humanity at present. In broader (simpler) terms, the Indian monsoon is often described as a large-scale sea-breeze circulation in response to ‘hot’ land surface and ‘cool’ oceans (Arabian Sea in the west and Bay of Bengal in the east) during the pre-monsoon months. In reality the Indian Monsoon is one of the most complex features of the earth’s climate which cannot be adequately simulated by climate models at present (Shukla 2007). In the last 25 years, hundreds of studies have been published on Indian/Asian monsoon and it is now widely accepted that the Indian monsoon onset and intensity are controlled by large-scale features of the atmosphere like the ENSO (El Nino-Southern Oscillation) cycle in the equatorial Pacific, the Eurasian snow cover during the preceding winter and the equatorial stratospheric Quasi-Biennial wind Oscillation, known in scientific literature as the QBO.
Will the Indian monsoon be adversely affected by climate change in future? Recent studies do not suggest any adverse impact at this point in time. The Indian monsoon has always exhibited significant departures from normal from time to time as can be seen in Figure 2 which shows seven major droughts and six major floods in the 150-year instrumental record. These droughts and floods are part of natural climate variability and do not show any linkage to climate change, human-induced or otherwise. The IPCC 2007 climate change documents project a mean temperature increase of about 10C for India in the next thirty years, while projecting less than 5 percent increase in monsoon precipitation. Several recent studies have identified a number of uncertainties in these projections and the future warming of the earth’s surface is now projected to be only about 10C to 1.50C over the next 100 years. In any case, the revised projections suggest only marginal changes in India’s climate over the next thirty years or more. The possibility of catastrophic future climate change impacts for India (ex. escalated sea-level rise on east or west coast) appears to be small at this time. Read more here.
Aug 17, 2008
Caspar and the Jesus paper
Bishop Hill Blog
There has been the most extraordinary series of postings at Climate Audit over the last week. As is usual at CA, there is a heavy mathematics burden for the casual reader, which, with a bit of research I think I can now just about follow. The story is a remarkable indictment of the corruption and cyncism that is rife among climate scientists, and I’m going to try to tell it in layman’s language so that the average blog reader can understand it. As far as I know it’s the first time the whole story has been set out in a single posting. It’s a long tale - and the longest posting I think I’ve ever written and piecing it together from the individual CA postings has been a long, hard but fascinating struggle. You may want to get a long drink before starting, and those who suffer from heart disorders may wish to take their beta blockers first.
At some time or another, most people will have seen the hockey stick - the iconic graph which purports to show that after centuries of stable temperatures, the second half of the twentieth century saw a sudden and unprecedented warming of the globe. This was caused, we were told, by mankind burning fossil fuels and releasing carbon dioxide into the atmosphere. For a while, the hockey stick was everywhere - unimpeachable evidence that mankind was damaging the planet - an impact that would require drastic measures to reverse. The stick’s most famous outing however was just a couple of years ago when it made a headlining appearance in Al Gore’s drama-documentary, An Inconvenient Truth. The revelation of the long, thin graph with its dramatic temperature rise in the last few decades, and the audience gasps that accompanied it, is something of a key moment for many environmentalists.
Shortly after its publication, the hockey stick and its main author, Michael Mann, came under attack from Steve McIntyre, a retired statistician from Canada. In a series of scientific papers and later on his blog, Climate Audit, McIntyre took issue with the novel statistical procedures used by the hockey stick’s authors. The controversy raged for several years, involving blue riband panels, innumerable blog postings, endless name-calling and dark insinuations about motivations and conflicts of interest. In May 2005, at the height of the controversy, and on the very day that McIntyre was making a rare public appearance in Washington to discuss his findings, two Mann associates, Caspar Amman and Eugene Wahl, issued a press release in which they claimed that they had submitted two manuscripts for publication, which together showed that they had replicated the hockey stick exactly, confirmed its statistical underpinnings and demonstrated that McIntyre’s criticisms were baseless. This was trumpeted as independent confirmation of the hockey stick. A few eyebrows were raised at the dubious practice of using a press release to announce scientific findings. Some also noted that on the rare occasions that this kind of announcement is made, it tends to be about papers that have been published, or at least accepted for publication. To make such a dramatic announcement about the submission of a paper was unusual in the extreme.
That the statistical foundations on which they had built this paleoclimate castle were a swamp of misrepresentation, deceit and malfeasance was, to Wahl and Amman, an irrelevance.
Read more about this long saga in this excellent summary here.
Aug 16, 2008
Backcasting with Computer Climate Models
Climate Skeptic
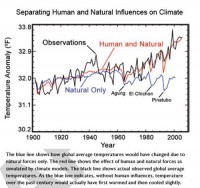
I found the chart below in the chapter Global Climate Change of the NOAA/NASA CCSP climate change report. I thought it was illustrative of some interesting issues:

See larger image here
The Perfect Backcast
What they are doing is what I call “backcasting,” that is, taking a predictive model and running it backwards to see how well it preforms against historical data. This is a perfectly normal thing to do.
And wow, what a fit. I don’t have the data to do any statistical tests, but just by eye, the red model output line does an amazing job at predicting history. I have done a lot of modeling and forecasting in my life. However, I have never, ever backcast any model and gotten results this good. I mean it is absolutely amazing. Of course, one can come up with many models that backcast perfectly but have zero predictive power.
In fact, it is fairly easy to demonstrate that the models are far better at predicting history than they are at predicting the future. This is the reason that neither this nor any other global warming alarmist report every shows a chart grading how model forecasts have performed against actual data: Because their record has been terrible. After all, we have climate model forecasts data all the way back from the late 1980’s—surely 20+ years is enough to get a test of their performance.
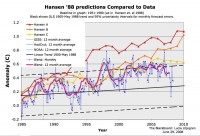
Below is the model forecasts James Hansen, whose fingerprints are all over this report, used before Congress in 1988 (in yellow, orange, and red), with a comparison to the actual temperature record (in blue).

See larger image here
You can see the forecasts began diverging from reality even as early as 1985. By the way, don’t get too encouraged by the yellow line appearing to be fairly close—the Hansen C case in yellow was similar to the IPCC B1 case which hypothesizes strong international CO2 abatement programs which have not come about. Based on actual CO2 production, the world is tracking, from a CO2 standpoint, between the orange and red lines. However, temperature is no where near the predicted values.
So the climate models are perfect at predicting history, but begin diverging immediately as we move into the future. That is probably why the IPCC resets its forecasts every 5 years, so they can hit the reset button on this divergence.
Read more here.
Aug 15, 2008
Deforestation Behind Loss of Mt Kilimanjaro Snow
By Felister Peter, IPPMedia
A scientific theory has linked the loss of snow on Mount Kilimanjaro to deforestation and dismissed suggestions that the dwindling of glaciers on Africa’s highest peak was due to global warming.
The theory is highlighted in a recent study report compiled by two researchers from Britain’s Portsmouth University, Nicholas Pepin and Martin Schaefer, who surveyed the mountain’s glaciers for 11 days. The researchers, who revealed their findings at a news conference in Dar es Salaam yesterday, said the mountain’s glacier surface had shrunk from 20 km in 1880 to a mere two kilometres in 2000.
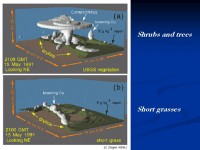
They said the development was caused more by local than regional factors, with Pepin suggesting that deforestation mainly due to extensive farming as the major cause. “Deforestation of the mountain’s foothills is the most likely culprit because without forests there is too much evaporation of humidity into outer space. The result is that moisture-laden winds blowing across those forests have become drier and drier,” he explained.
“Loss of humidity automatically leads to a reduction in cloud cover. Clouds play a crucial role in protecting ice from sunrays, with fewer sunrays meaning faster freezing of water,: he added, citing reduced precipitation as another reason for the receding ice cover on the mountain’s summit.

See larger image here
Last year, another study on the dwindling ice cover on the mountain`s cap suggested that global warming had nothing to do with the alarming loss of its beautiful snows. The scientists who conducted the study, US-based Philip Mote and Georg Kaser, assertively linked the problem to a process known as sublimation. Revealing the findings they first published last year in the American Scientist magazine, the experts cautioned that using Mount Kilimanjaro as a “poster child” for climate change was awfully inaccurate.
In remarks at yesterday`s news conference, Journalists Environmental Association of Tanzania chairman Deo Mfugale also linked the loss of glaciers on Mount Kilimanjaro to human activities rather than global warming. He called for an end to the random felling trees and burning forests, mainly done for charcoal and timber, saying these and related practices led to the destruction of some 15 per cent of forests in Tanzania between 1976 and last year. Read more here.
Aug 06, 2008
CCSP Climate Impacts Report: A Perversion of Science
By Chip Knappenberger, World Climate Report
Luckily, the U.S. Climate Change Assessment Report just released by the U.S. Climate Change Science Program (CCSP) is only a “draft” released for the purpose of gathering public comments. This means that the report’s authors still have time to get things in order before a “final” publication is released. The current contents read as if the CCSP authors set aside their list of sizable scientific credentials, and instead opted to write a fantasy piece on how they wished the state of climate science to be, rather than how it actually is.
As it now stands, the draft CCSP report is a gross perversion of science. It is made even worse that it is coming from a group researchers, who, at one time at least, were regarded as some of the leaders in their fields. No fair treatment of science discusses a topic with complete disregard to opposing views that are held and published by other credible, qualified and knowledgeable persons. And yet this is precisely what is contained, ad nauseum, within the draft of the CCSP synthesis report.
The report reads as a simple rehashing of the “pet opinions” held by its authors and completely ignoring that these opinions have been harshly disputed and criticized in the scientific literature and elsewhere by other equally qualified researchers as being based upon faulty methodology and inappropriate inferences. It is as if the CCSP authors think that if they just keep repeating the same things over and over again in different fora, they will eventually become true-or at least that the critics will have become so exasperated by their audacity and simply grow tired of responding.
I am at a loss for complimentary adjectives to describe people who are tasked by the U.S. government with assessing climate change and its potential impacts on the United States for the clear (although unstated, wink, wink) purpose of influencing policy and who know of legitimate scientific viewpoints which counter their own but yet act as if such opposition entirely doesn’t exist. I have never read a more pessimistic report on climate change (other than perhaps coverage of Al Gore’s we-are-going-to-make-the-earth-uninhabitable-for-people proclamations)-and this coming from a supposed august scientific body. There are virtually no positive aspects of climate change presented or even postulated. Any that are briefly touched upon are almost inevitably countered with subsequent text along the lines of “but that effect will only be temporary.”
What kind of people think that the population of Americans will only suffer if the climate heats up by a few degrees? If you were to track the ‘average temperature’ experienced by the ‘average American’ over time (which we did in an analysis a few years ago), based upon population movements alone, you would find that the experiential temperature is increasing at a rate that is greater than many of the projected scenarios of climate change. In other words, the population movements made by American’s free will-primarily movements to more urban centers and southerly locales-has resulted in the ‘average American’ experiencing a climate that is about 3 degrees F warmer at the end of the 20th century than at the beginning-and that doesn’t even take into effect the inherent added warmth in urban environments. These changes are independent of actual climate changes.
See maps of the experiential and actual temperature changes and read much more in this stinging but on the mark commentary on this pervsion of real science here.
|
|
|
|


